XYZ's of Oscilloscopes
CHAPTER 01
CHAPTER 01
Oscilloscope Basics

What is an oscilloscope?
An oscilloscope (informally scope, oscope, or O-scope) is a diagnostic instrument that draws a graph of an electrical signal.
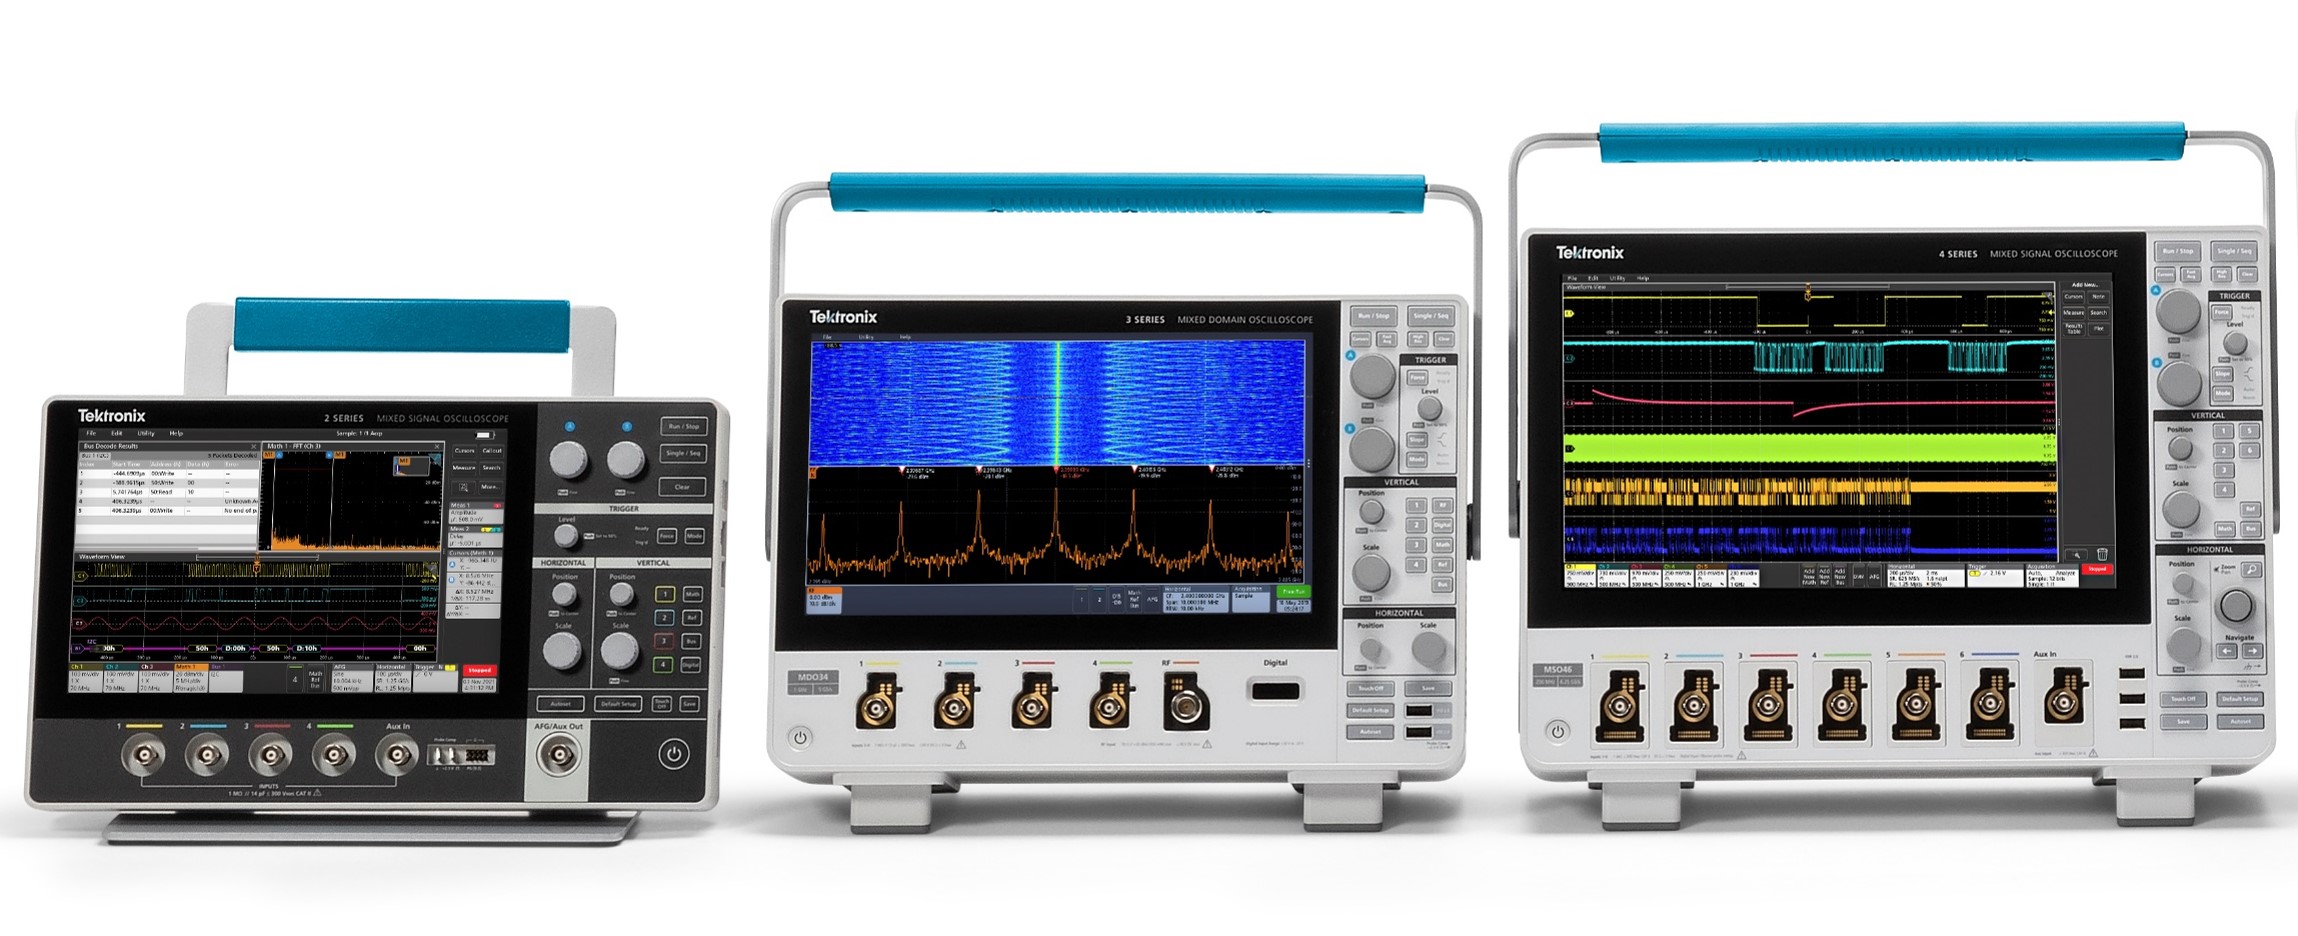
View the complete lineup of Tektronix oscilloscopes »
Oscope Basics
Oscilloscopes are versatile electronic instruments that are commonly used by engineers to perform waveform and signal analysis in electronic circuits. By connecting probes to different points in a circuit, oscilloscopes can display and measure voltage waveforms, analyze signal integrity, debug circuit problems, and analyze signal frequency and phase. With the ability to capture and visualize electronic signals in real-time, oscilloscopes are a crucial tool for engineers to optimize the performance of their circuits and ensure that they are functioning as intended.
Understanding oscilloscope basics is critical to almost all product design.

Waveform and Signal Analysis
Nearly all consumer products today have electronic circuits. Whether a product is simple or complex, if it includes electronic components, the design, verification, and debugging process requires an oscilloscope to analyze the numerous electrical signals that make the product come to life.
This simple graph can tell you many things about a signal, such as:
- The time and voltage values of a signal.
- The frequency of an oscillating signal.
- The "moving parts" of a circuit represented by the signal.
- The frequency with which a particular portion of the signal occurs relative to other portions.
- Whether or not a malfunctioning component is distorting the signal.
- How much of a signal is direct current (DC) or alternating current (AC).
- How much of the signal is noise and whether the noise is changing with time.
The Osilloscope's Graph
At the most basic level, an oscilloscope's graph of an electrical signal shows how the signal changes over time (Figure 2):
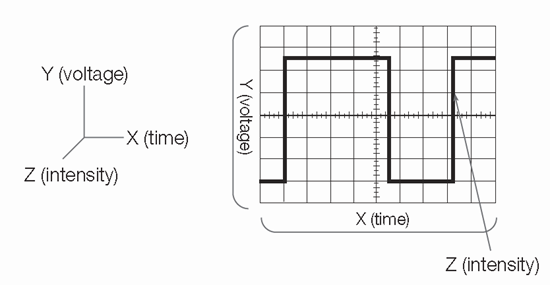
Figure 2: X, Y, and Z components of a displayed waveform.
The intensity or brightness of the display is sometimes called the Z-axis. In Digital Phosphor Oscilloscopes (DPO), the Z-axis can be represented by color grading of the display (Figure 3).
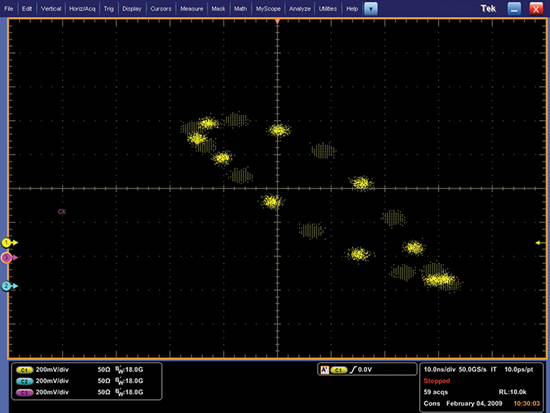
Figure 3:Two offset clock patterns with Z axis intensity grading.
The Significance of Signal Integrity
A key benefit of an o scope is its ability to accurately reconstruct a signal. The better the reconstruction of the signal the higher the signal integrity. Here's one way to think of signal integrity. An oscilloscope is analogous to a camera that captures signal images that you then observe and interpret. Several key issues lie at the heart of signal integrity:
- When you take a picture, is it an accurate representation of what actually happened?
- Is the picture clear or fuzzy?
- How many accurate pictures can you take per second?
The different systems and performance capabilities of an o-scope contribute to its ability to deliver the highest signal integrity possible. Probes also affect the signal integrity of a measurement system.
This primer helps you understand all of these elements so you can choose and use the oscilloscope appropriate for your application. Before you begin evaluating o-scopes, you need to understand the basics of waveforms and waveform measurements.
This information is covered in this chapter. It's the foundation of putting an o scope to work for you.
Understanding Waveforms and Waveform Measurements
The generic term for a pattern that repeats over time is a wave. Sound waves, brain waves, ocean waves,
and voltage waves are all repetitive patterns. An oscope measures voltage waves. A waveform is a graphic representation of a wave.
Physical phenomena such as vibrations, temperature, or electrical phenomena such as current or power can be converted to a voltage by a sensor. One cycle of a wave is the portion of the wave that repeats. A voltage waveform shows time on the horizontal axis and voltage on the vertical axis.
Waveform shapes reveal a great deal about a signal. Any time you see a change in the height of the waveform, you know the voltage has changed. Any time there is a flat horizontal line, you know that there is no change for that length of time.
Straight, diagonal lines mean a linear change; a rise or fall of voltage at a steady rate. Sharp angles on a waveform indicate sudden change. Figure 4 shows common waveforms.
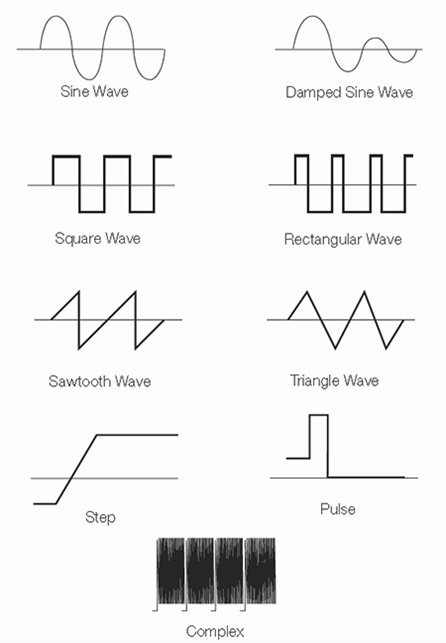
Figure 4:Common waveforms
Figure 5 displays sources of common waveforms, such as electrical outlets, computers, automobiles, and televisions.
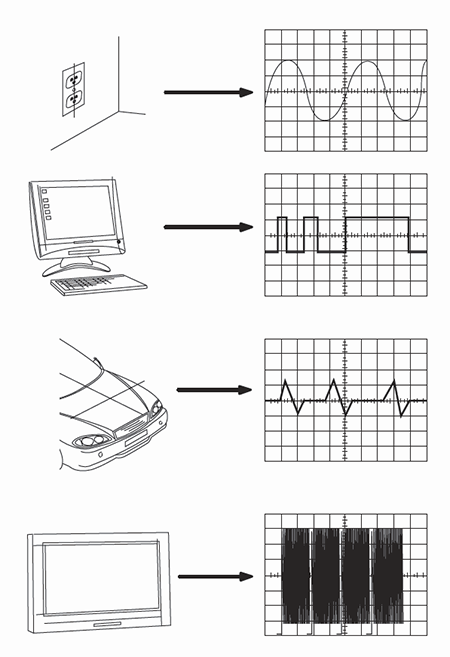
Figure 5: Sources of common waveforms
Types of Waves
You can classify most waves into these types:
- Sine waves.
- Square and rectangular waves.
- Sawtooth and triangle waves.
- Step and pulse shapes.
- Periodic and non-periodic signals.
- Synchronous and asynchronous signals.
- Complex waves.
Next we'll look at each of these types of waves.
Sine Waves
The sine wave is the fundamental wave shape for several reasons. It has harmonious mathematical properties"€it is the same sine shape you may have studied in trigonometry class.
The voltage in a wall outlet varies as a sine wave. Test signals produced by the oscillator circuit of a signal generator are often sine waves.
Most AC power sources produce sine waves (AC signifies alternating current, although the voltage alternates too; DC stands for direct current, which means a steady current and voltage, such as a battery produces.) The damped sine wave is a special case you may see in a circuit that oscillates, but winds down over time.
Square and Rectangular Waves
The square wave is another common wave shape. Basically, a square wave is a voltage that turns on and off (or goes high and low) at regular intervals. It is a standard wave for testing amplifiers. Good amplifiers increase the amplitude of a square wave with minimum distortion.
Television, radio, and computer circuitry often use square waves for timing signals. The rectangular wave is like the square wave except that the high and low time intervals are not of equal length. It is particularly important when analyzing digital circuitry.
Sawtooth and Triangle Waves
Sawtooth and triangle waves result from circuits designed to control voltages linearly, such as the horizontal sweep of an analog oscope or the raster scan of a television.
The transitions between voltage levels of these waves change at a constant rate. These transitions are called ramps.
Step and Pulse Shapes
Signals such as steps and pulses that occur rarely, or non-periodically, are called single-shot or transient signals.
A step indicates a sudden change in voltage, similar to the voltage change you see if you turn on a power switch.
A pulse indicates sudden changes in voltage, similar to the voltage changes you see if you turn a power switch on and then off again. A pulse might represent one bit of information traveling through a computer circuit or it might be a glitch, or defect, in a circuit.
A collection of pulses traveling together creates a pulse train. Digital components in a computer communicate with each other using pulses. These pulses may be in the form of a serial data stream or multiple signal lines may be used to represent a value in a parallel data bus. Pulses are also common in x-ray, radar, and communications equipment.
Periodic and Non-periodic Signals
Repetitive signals are referred to as periodic signals, while signals that constantly change are known as non-periodic signals. A still picture is analogous to a periodic signal, while a movie is analogous to a non-periodic signal.
Synchronous and Asynchronous Signals
When a timing relationship exists between two signals, those signals are referred to as synchronous. Clock, data, and address signals inside a computer are examples of synchronous signals.
Asynchronous signals are signals between which no timing relationship exists. Because no time correlation exists between the act of touching a key on a computer keyboard and the clock inside the computer, these signals are considered asynchronous.
Complex Waves
Some waveforms combine the characteristics of sines, squares, steps, and pulses to produce complex wave shapes. The signal information may be embedded in the form of amplitude, phase, and/or frequency variations.
For example, although the signal in Figure 6 is an ordinary composite video signal, it is composed of many cycles of higher-frequency waveforms embedded in a lower-frequency envelope.
In this example, it is important to understand the relative levels and timing relationships of the steps. To view this signal, you need an oscilloscope that captures the low-frequency envelope and blends in the higher-frequency waves in an intensity-graded fashion so that you can see their overall combination as an image you can interpret visually.
Digital phosphor oscilloscopes (DPOs) are best suited to viewing complex waves, such as the video signals shown in Figure 6. Their displays provide the necessary frequency-of-occurrence information, or intensity grading, that is essential to understanding what the waveform is really doing.
Some oscopes can display certain types of complex waveforms in special ways. For example, telecommunications data may be displayed as an eye pattern or a constellation diagram:
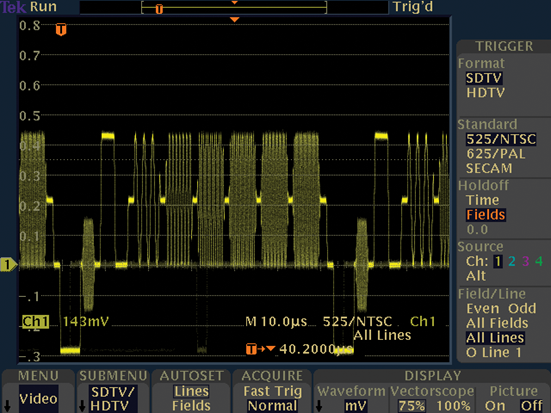
Figure 6: An NTSC composite video signal is an example of a complex wave.
Telecommunications digital data signals can be displayed on an o scope as a special type of waveform referred to as an eye pattern. The name comes from the similarity of the waveform to a series of eyes (Figure 7).
Eye patterns are produced when digital data from a receiver is sampled and applied to the vertical input, while the data rate is used to trigger the horizontal sweep. The eye pattern displays one bit or unit interval of data with all possible edge transitions and states superimposed in one comprehensive view.
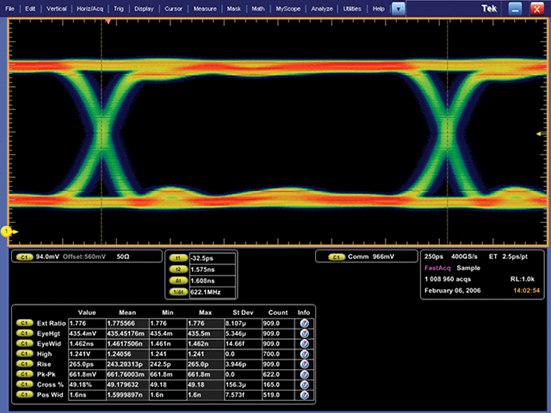
Figure 7: 622 Mb/s serial data eye pattern.
A constellation diagram is a representation of a signal modulated by a digital modulation scheme such as quadrature amplitude modulation or phase-shift keying.
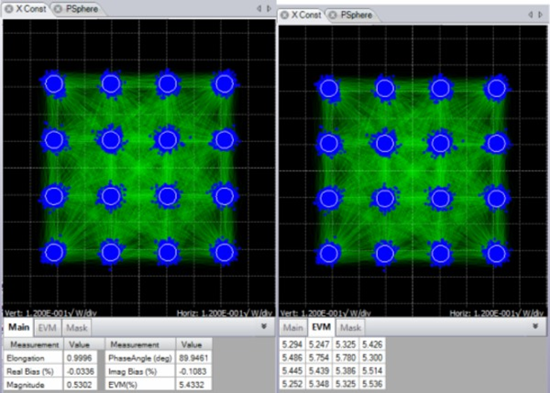
Constellation Diagram.
Waveform Measurements
Many terms are used to describe the types of measurements you make with an oscope. Next we'll look at some of the most common measurements and terms.
Frequency and Period
If a signal repeats, it has a frequency. Frequency is measured in Hertz (Hz) and is the number of times the signal repeats itself in one second. This is also referred to as cycles per second.
A repetitive signal also has a period, which is the amount of time it takes the signal to complete one cycle.
Period and frequency are reciprocals of each other, so that:
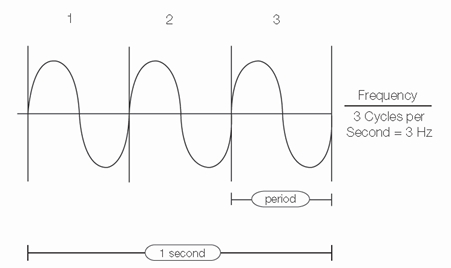
Figure 8: Frequency and period of a sine wave.
Voltage
Voltage is the amount of electric potential, or signal strength, between two points in a circuit. Usually, one of these points is ground, or zero volts, but not always. You may want to measure the voltage from the maximum peak to the minimum peak of a waveform, referred to as the peak-to-peak voltage.
Amplitude
Amplitude is the amount of voltage between two points in a circuit. Amplitude commonly refers to the maximum voltage of a signal measured from ground, or zero volts. The waveform shown in Figure 9 has an amplitude of 1 V and a peak-to-peak voltage of 2 V.
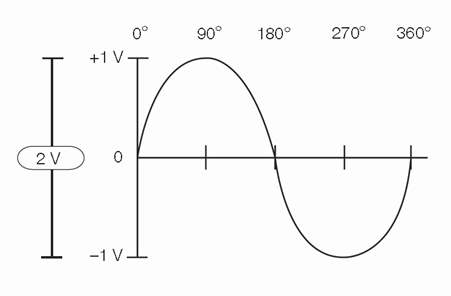
Figure 9: Amplitude and degrees of a sine wave.
Phase
Phase is best explained by looking at a sine wave. The voltage level of sine waves is based on circular motion. Given that a circle has 360°, one cycle of a sine wave has 360°, as shown in Figure 10.
Using degrees, you can refer to the phase angle of a sine wave when you want to describe how much of the period has elapsed.
Phase shift describes the difference in timing between two otherwise similar signals. The waveform in Figure 10 labeled "current" is said to be 90° out of phase with the waveform labeled "voltage," since the waves reach similar points in their cycles exactly 1/4 of a cycle apart (360°/4 = 90°). Phase shifts are common in electronics.
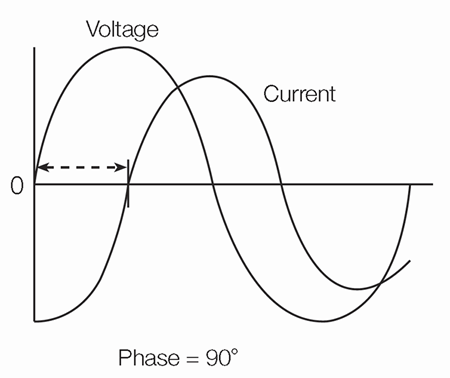
Figure 10: Phase shift.
Waveform Measurements with Digital Oscopes
Digital o-scopes have functions that make waveform measurements easy. They have front-panel buttons and screen-based menus from which you can select fully-automated measurements. These include amplitude, period, rise/fall time, and many more.
Many digital oscilloscopes also provide mean and RMS calculations, duty cycle, and other math operations. Automated measurements appear as on-screen alphanumeric readouts. Typically these readings are more accurate than is possible to obtain with direct graticule interpretation.
